
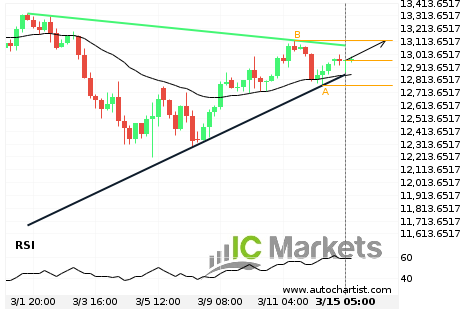
Inminente recuperación o irrupción del US Tech 100 Index
El US Tech 100 Index se dirige a la línea de resistencia de un Triángulo. Si este movimiento se mantiene, esperamos que el precio de US Tech 100 Index pruebe el nivel de 13119.6000 en las próximas 3 días. Pero no se apresure en sus operaciones, porque ya ha probado esta línea en numerosas ocasiones, […]

Inminente recuperación o irrupción del FACEBOOK
El FACEBOOK se dirige a la línea de soporte de un Canal alcista. Si este movimiento se mantiene, esperamos que el precio de FACEBOOK pruebe el nivel de 264.3700 en las próximas 6 horas. Pero no se apresure en sus operaciones, porque ya ha probado esta línea en numerosas ocasiones, por lo que este movimiento […]
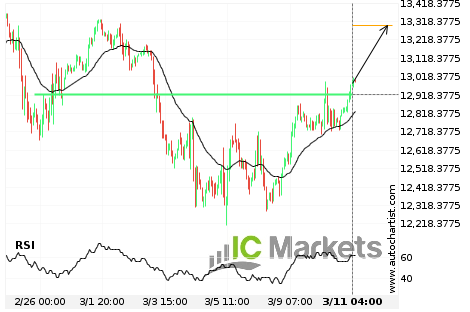
El US Tech 100 Index atravesó la importante línea de precio de 12920.4004
El US Tech 100 Index atravesó la línea de resistencia de un Resistencia. Ha entrado en contacto con esta línea en numerosas ocasiones en los últimos 14 días. Esta irrupción muestra un movimiento potencial en el nivel de 13294.6104 dentro de las próximas 3 días. Ya hemos observado un retroceso desde esta posición en el […]
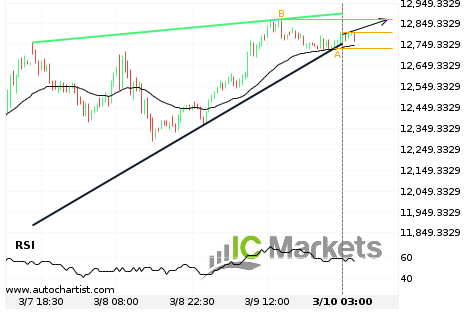
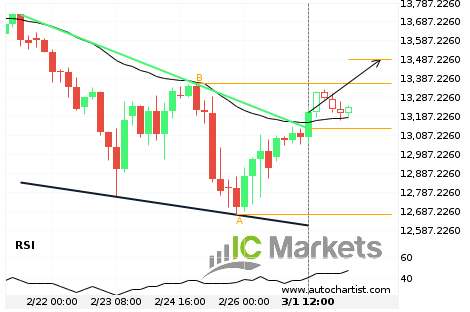
Inminente recuperación o irrupción del US Tech 100 Index
El US Tech 100 Index se dirige a la línea de resistencia de un Cuña ascendente. Si este movimiento se mantiene, esperamos que el precio de US Tech 100 Index pruebe el nivel de 12870.5000 en las próximas 16 horas. Pero no se apresure en sus operaciones, porque ya ha probado esta línea en numerosas […]
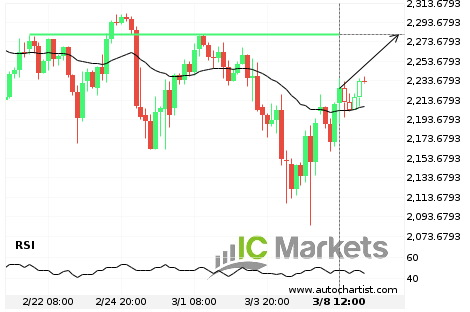
El US Small Cap 2000 Index se acerca a la importante línea de precio de 2281.1299
El US Small Cap 2000 Index se está acercando a la línea de resistencia de un Resistencia. Ha entrado en contacto con esta línea por lo menos dos veces en 15 días. Si prueba esta línea de nuevo, lo hará en las próximas 2 días.
Irrupción inminente de el soporte por el Biogen Idec Inc
El Biogen Idec Inc avanza hacia la línea de soporte de un Canal bajista, que ya ha probado varias veces en el pasado. Hemos visto un retroceso antes desde esta línea, así que en esta etapa no está claro si atravesará esta línea o se recuperará como lo ha hecho anteriormente. Si el Biogen Idec […]
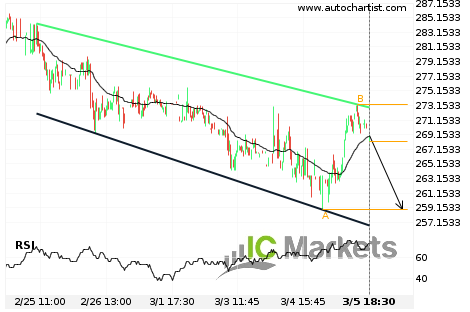
El US Tech 100 Index ha atravesado la resistencia
El US Tech 100 Index atravesó la línea de resistencia de un Cuña descendente. Ha entrado en contacto con esta línea por lo menos dos veces en 11 días. Esta ruptura indica un movimiento potencial a 13490.8055 en 2 días. Como ya vimos un retroceso de esta posición en el pasado, debemos esperar la confirmación […]
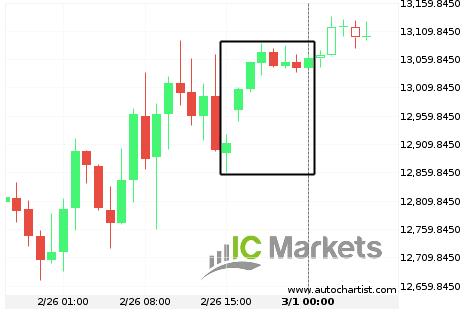
El US Tech 100 Index experimentó un movimiento excepcional
Para aquellos de ustedes que no creen en las tendencias, esta puede ser una oportunidad para aprovechar un excepcional movimiento de un 1,16% de US Tech 100 Index. Este movimiento está ocurriendo desde hace 3 días. Por otro lado, para aquellos que siguen las tendencias, deben considerar aprovecharse de esta.
El ALPHABET INC CLASS C experimentó un movimiento excepcional
Para aquellos de ustedes que no creen en las tendencias, esta puede ser una oportunidad para aprovechar un excepcional movimiento de un 3,78% de ALPHABET INC CLASS C. Este movimiento está ocurriendo desde hace 2 días. Por otro lado, para aquellos que siguen las tendencias, deben considerar aprovecharse de esta.
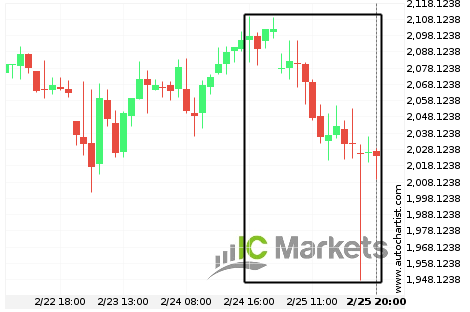
¿Qué está ocurriendo con el US SPX 500 Index?
Aquellos de ustedes que sean seguidores de tendencia probablemente estarán observando ansiosamente al US SPX 500 Index para comprobar si el último movimiento de un 1,87% continúa. Si no lo hace, las personas fieles al método de reversió de la media estarán encantadas de ganar con este excepcional movimiento en 23 horas.